Tracking COVID-19 Data Reporting & Analysis in the U.S.: DECEMBER 2020
Population Council research shows that COVID-19 data reporting and analysis in the United States continue to be inadequate and incomplete, leaving federal and state governments ill-equipped with the most basic information they need to make real-time decisions to anticipate, control, and mitigate the spread of coronavirus.
Throughout the course of the pandemic, Population Council researchers have been tracking how COVID-19 data is reported and analyzed using a comprehensive analysis of 62 COVID-19 data sources from the Centers for Disease Control and Prevention (CDC), health departments across 50 states, Washington DC, and ten cities. They assessed data completeness for COVID-19 testing and four outcomes (cases, hospitalizations, recoveries, and deaths), and examined disaggregation of COVID-19 testing and outcomes by a core set of demographic indicators, including age, race/ethnicity, sex/gender, geography, and underlying health conditions. This analysis also investigated how social and community level data were reported and analyzed, variations in data reporting, and changes over the course of the pandemic by comparing data across three time points: May, August and December, 2020.
Charlotte Brasseux, MPH Candidate, Mailman School of Public Health at Columbia University
Saleh Abbas, MPH, Mailman School of Public Health at Columbia University
Mingqi Song, MPA, School of International and Public Affairs at Columbia University
Thoai D. Ngo, PhD, MHS, GIRL Center, Population Council

KEY FINDINGS
COVID-19 Data Remains Incomplete with Little Improvement
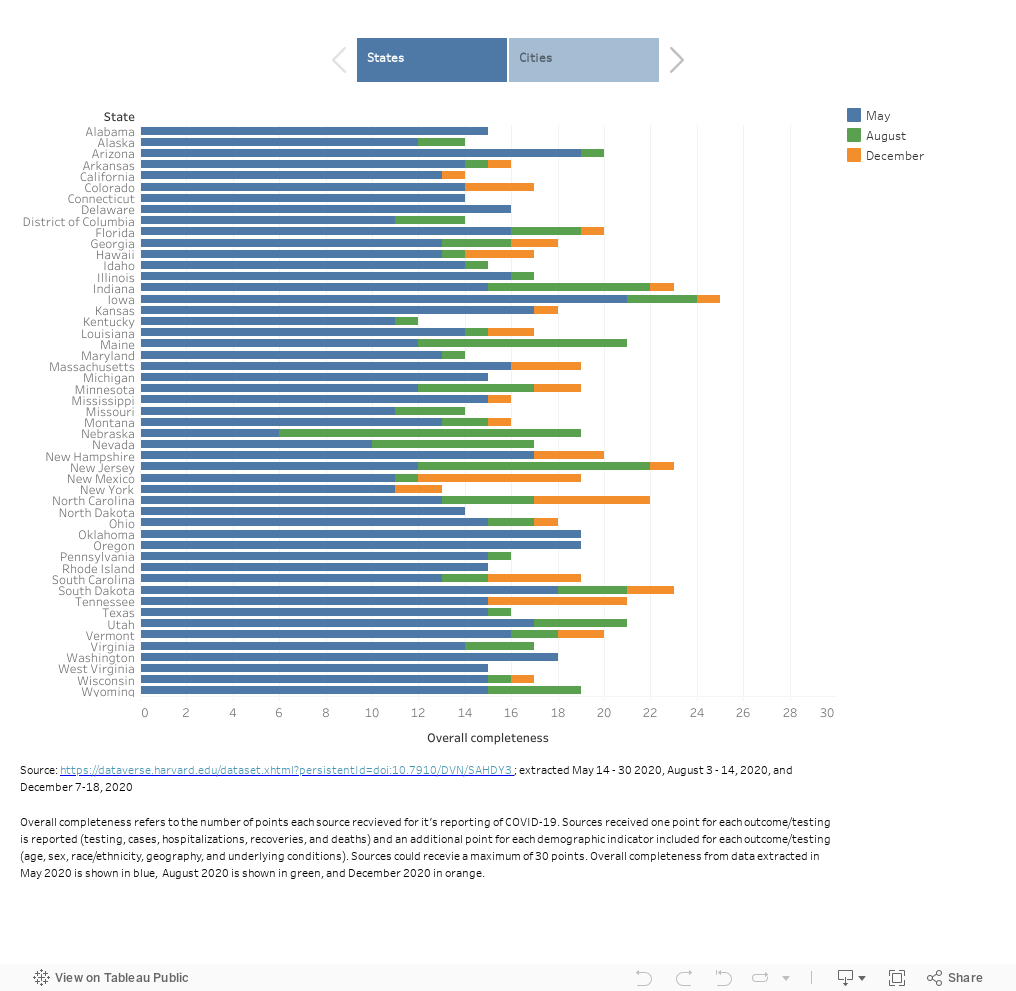
Across the 50 states and District of Columbia (DC), the overall data completeness score has improved slightly since May, with larger improvement between May and August compared to between August and December:
State average data completeness score (out of 30): May: 14.3 [range: 6-21]; August: 16.3 [range: 11-24]; December: 17.4 [range: 12-25]
City average data completeness score (out of 30): May: 10.7 [range: 0-18]; August: 12.1 [range: 0-18]; December: 12.8 [range: 0-20]
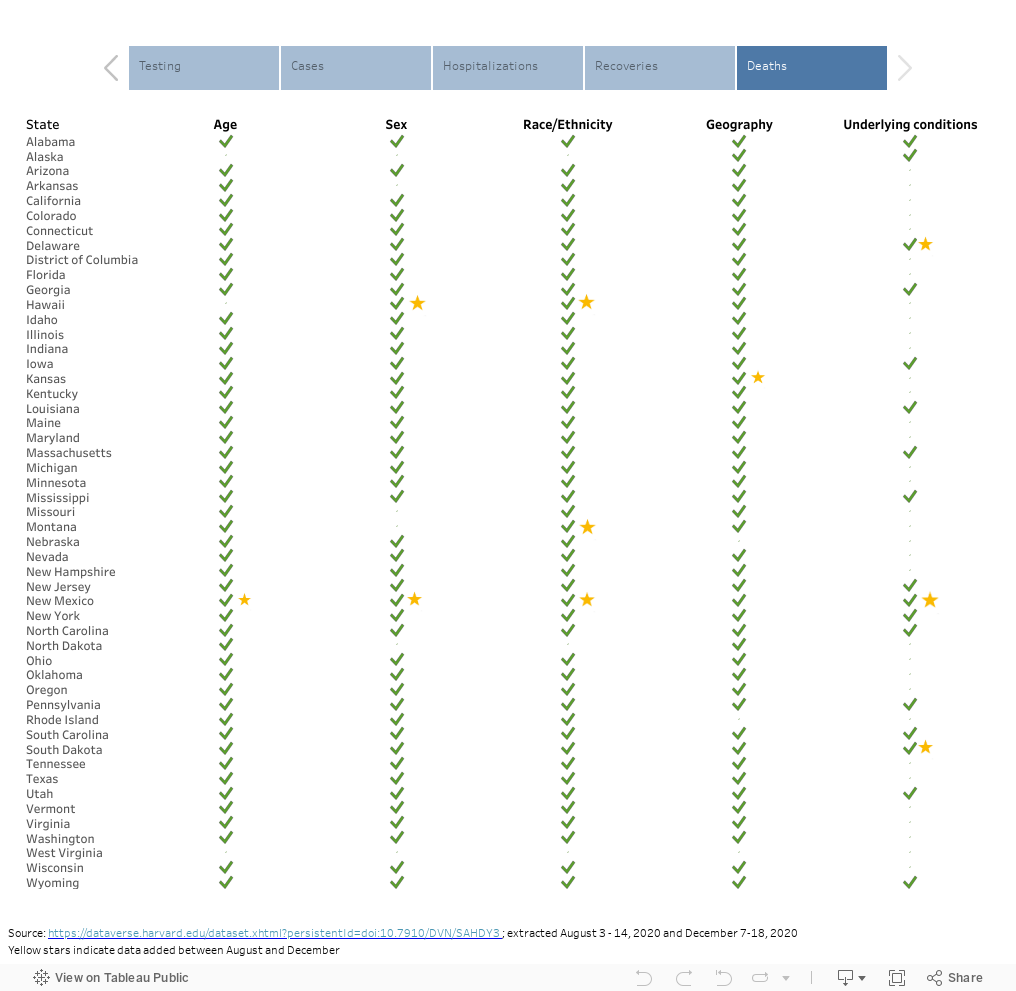
Disaggregation of COVID-19 Testing and Outcomes by Basic Demographic Indicators is Inadequate
No significant improvements in disaggregation of key indicators (age, sex, race/ethnicity, geography, underlying conditions) were noted between August and December.
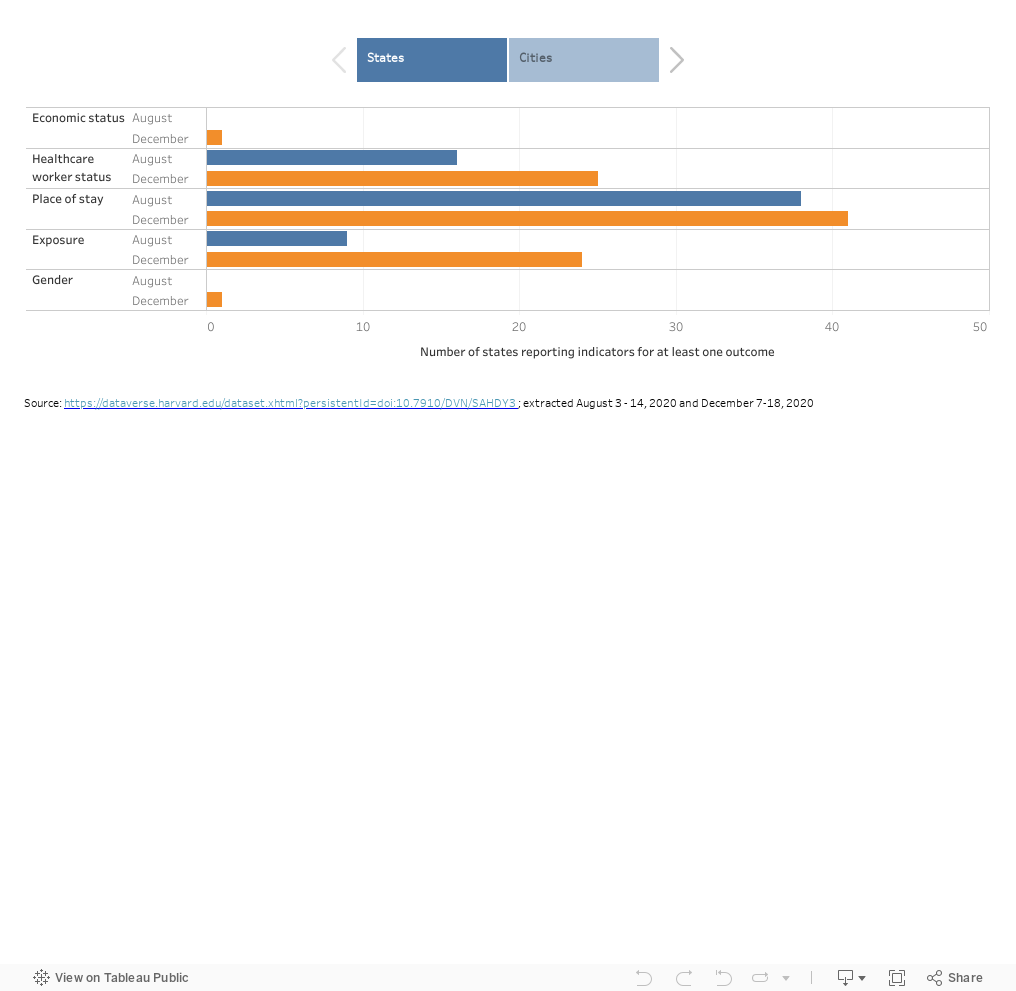
Reporting on Social, Occupational, and Community Level Data Improved but Remains Limited
There were noticeable improvements in reporting of social, occupational, and community level indicators between August and December, but they remain severely inadequate. Reporting these indicators was most common for cases and deaths and was far less common for testing, hospitalizations, and recoveries.
Data Reporting Remains Inconsistent and Unstandardized Across US States and Cities
Definitions of outcomes and indicators, as well as methodologies for data collection, are varied across data sources. Furthermore, it has been difficult to identify all data points, as many states and cities report COVID-19 data on multiple webpages, reports, and dashboards.
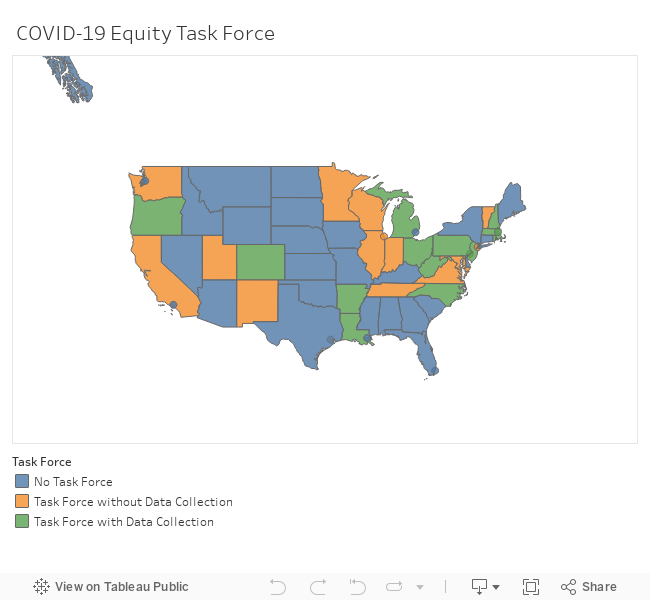
Only Half of States and Cities Tackle Equity Data Related to COVID-19
26 states and five cities had an established equity task force, working group, response team, or departmental body to address health inequities and disparities related to COVID-19, which is an improvement from 15 states and four cities in August.
Only 13 out of the 31 data sources with task forces mentioned data collection, and of these, only 7 mentioned specific collection metrics: the guidance on data collection mainly focused on race/ethnicity data.
Data on gender (beyond male/female), poverty level, and ethnicity continue to be neglected across states and cities.
The investigation of how multiple social and demographic indicators interact to affect COVID-19 outcomes (intersectional analysis) has slightly diminished.
Key Takeaways
One year into the pandemic, the U.S. has not made any substantial improvement in its COVID-19 data reporting and analyses at the national, state, and city levels. The lack of significant improvements in data reporting suggest that health officials and governments are not investing in or using critical data to guide their pandemic response.
Though improvements in reporting of social, occupational, and community level indicators has improved slightly, they remain severely inadequate. The dramatic differences between each source’s definition of these indicators makes it difficult to determine any conclusive trends on who COVID-19 is affecting and where in order for health officials to conduct robust test, trace, and isolate responses.
While hospitals in the US are facing a crisis-level shortage of beds and staff, data on hospitalizations have consistently been underreported. Even with the recent release of hospital capacity data at national and local levels by the U.S. Department of Health and Human Services (HHS), simple sociodemographic information on hospitalization cases does not exist, making it difficult to get a full picture of who within a community is affected.
While COVID-19 is infecting and killing Black and brown communities at higher rates, only half of the states and cities have made progress towards collecting data related to equity. The lack of intersectionality analysis of COVID-19 and the negligence of gender, poverty, and ethnicity data hamper health officials’ ability to understand intersecting risks of COVID-19 among poor communities and people of color.
A lack of standardized reporting combined with increasingly available, new data on hospital capacity and vaccination makes it clear that there is a critical need for a more integrated data system to adequately track and respond to this pandemic and future outbreaks.
OVERALL DATA COMPLETENESS
In December, 50 states and DC scored an average of 17.4 out of the 30 points [range: 12-25] for overall data completeness, demonstrating a slight increase from May (14.3) and August (16.3)
The ten cities had an average of 12.8 out of 30 points [range: 0 - 20] for overall data completeness, again depicting a slight increase from May (10.7) and August (12.1)
DISAGGREGATION BY KEY DEMOGRAPHIC INDICATORS
We observed improvements in the disaggregation of COVID-19 testing and outcomes by demographic indicators; however, they remain limited.
Demographic indicators were most disaggregated for cases and deaths, followed by hospitalizations, and were least disaggregated for testing and recoveries.
COVID-19 testing and outcomes were most disaggregated by geography, followed by age, race/ethnicity, and sex. They are disaggregated by underlying conditions at far less frequency.
SOCIAL, OCCUPATIONAL, AND COMMUNITY LEVEL INDICATORS
Compared to August 2020, one additional source reported on economic status, 11 additional sources reported on healthcare worker status, four additional sources reported on place of stay, 16 additional sources reported on exposure, and one additional source reported on gender in December 2020.
COVID-19 EQUITY DATA AND TASK FORCES
Overall data completeness score was slightly higher across the states and cities with established health equity task forces. The 26 states identified in December scored an average of 17.77 out of 30 points [range: 13-23]. The 5 cities identified in December scored an average of 15.2 out of 30 points [range: 5-20].
Of the 26 states and five cities with a health equity task force in December 2020, only 16 specifically mentioned improved data collection as a means to address inequity, and only seven gave specific data collection metrics. Guidance on data collection was almost exclusively about data on race and ethnicity, with Louisiana and New Jersey being the only states that mentioned collection of demographic data other than race/ethnicity data.
RATIONALE
As of January 2021, the United States remains the epicenter for COVID-19, with the highest number of infections and deaths in the world – surpassing 25 million infections and 400,000 deaths. Previous analyses showed that reporting on COVID-19 data was incomplete and inadequate, limiting the potential for robust analyses that could guide a targeted pandemic response. Having accurate data reporting and analysis at the local, state, and national levels would help steer containment efforts, build a more targeted response strategy, and foster learnings across cities and states as new hotspots arise.
OBJECTIVE
We assessed how COVID-19 data is reported and analyzed in the U.S. at the national, state, and city levels. We examined data completeness and data disaggregation of COVID-19 testing, cases, hospitalizations, recoveries, and deaths by a core set of demographic indicators (i.e. age, race/ethnicity, sex/gender, geography, and underlying health conditions). We also explored the gaps in data reporting, how these official data sources examine the intersecting vulnerabilities of COVID-19, and how data reporting has changed over the course of the pandemic across three time points: May, August, and December 2020.
METHOD
We reviewed 62 COVID-19 data sources from the Centers for Disease Control and Prevention (CDC), health departments across 50 states, Washington DC, and ten major cities in the United States between December 7-18, 2020. “Data sources” refers to daily and weekly COVID-19 reports, along with COVID-19-specific webpages and dashboards accessed through the health department’s websites from the CDC, 50 states and DC, and ten cities. We extracted information on testing and outcomes of COVID-19: cases, hospitalizations, recoveries, and deaths. We examined whether the sources disaggregated these outcomes by five demographic indicators: age, sex, race/ethnicity, geography, and underlying conditions. We also looked at data on social, occupational, and community level indicators: economic status, healthcare worker status, place of stay, exposure, and gender.
To determine completeness and disaggregation, we looked for whether each source reported each of the five outcomes and whether each outcome was disaggregated by the 5 demographic indicators. We gave each source one point for each outcome it reported (testing, cases, hospitalizations, recoveries, and deaths), and an additional point for each demographic indicator included for each outcome (age, sex, race/ethnicity, geography, and underlying conditions). Each source could receive up to 30 points. We compared our analysis across three time points (May, August, December 2020), representing the most comprehensive data review to date.
This project was featured in Think Global Health.
Read “Tackling the U.S. Coronavirus Data Catastrophe” from authors Thoai Ngo , Charlotte Brasseux, Saleh Abbas and Mingqi Song.