Tracking COVID-19 Data Reporting & Analysis in the U.S.: MAY 2020
Data on key demographic indicators allows for more sophisticated and intersectional analysis of COVID-19, moving beyond analysis of any one group or any one factor, and taking into account multiple vulnerabilities. Population Council researchers reviewed 70 COVID-19 data sources from the Centers for Disease Control and Prevention (CDC) and health departments across 50 states, nine territories, and 10 major cities in the United States to assess how COVID-19 data are reported on testing and four key outcomes: cases, hospitalizations, recoveries, and deaths. They examined whether and how these data sources disaggregated testing and outcomes by a core set of demographic indicators, such as age, race/ethnicity, sex/gender, education level, economic status, geography, and underlying health conditions, which are essential in understanding the circumstances of people’s lives and what may put them at risk for COVID-19 outcomes.
Charlotte Brasseux, Mailman School of Public Health at Columbia University
Mingqi Song, School of International and Public Affairs at Columbia University
Thoai D. Ngo, GIRL Center, Population Council

KEY FINDINGS
COVID-19 data reporting is inconsistent and incomplete across the all U.S. states, 9 territories, and 10 selected cities. There is no standardized reporting of COVID-19 data across sources between the CDC, state, territory, and city health departments (i.e. there is no standardized inclusion of key demographic indicators and definitions, COVID-19 outcomes, and reporting timelines in reporting requirements).
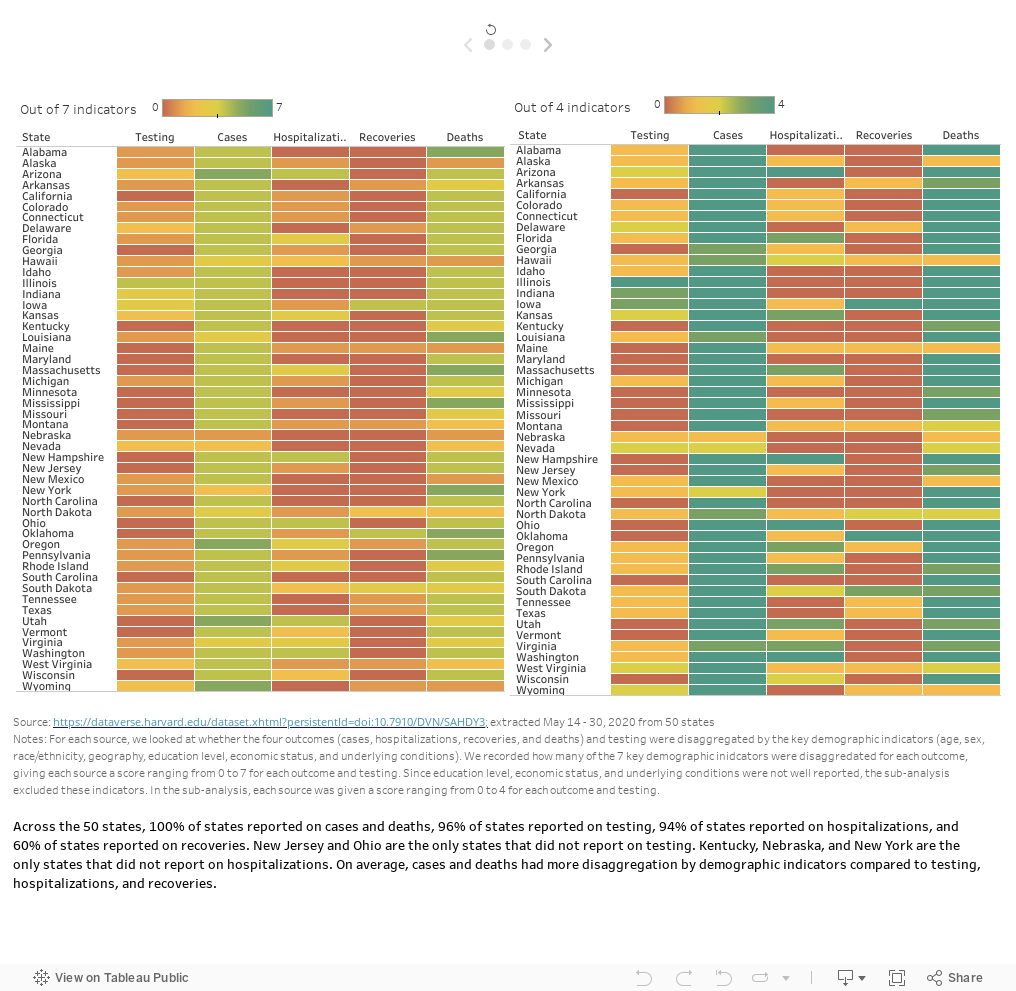
Less than half of the 70 data sources included information on all four COVID-19 outcomes (cases, hospitalizations, recoveries, and deaths), and testing. 94% reported on cases and 93% reported on deaths, while only 86% reported on testing, 76% reported on hospitalizations, and 57% reported on recoveries. Data on cases and deaths was commonly disaggregated by geography, age, sex, and/or race/ethnicity, whereas data on cases and deaths was less commonly disaggregated by underlying health conditions, economic status, and/or education level.
Across all 70 data sources, none of the four outcomes or testing were disaggregated by education level, and only New York City and Los Angeles disaggregated outcomes by economic status (i.e. poverty levels). This restricts health officials from understanding the risk profiles by economic status associated with COVID-19.
Data on race/ethnicity was most commonly disaggregated for cases and deaths, and was far less commonly disaggregated for testing, hospitalizations, and recoveries. Reporting of race and ethnicity was not standardized – some data sources had race and ethnicity as separate indicators, while others combined them.
The data sources used the terms “sex” and “gender” interchangeably to indicate “male” and “female,” and there was no reporting on gender identity or sexual orientation, preventing identification of cases and deaths among LGTBQ+ communities.
Less than one-third (31.4%) of the 70 data sources examined the intersection of more than one key demographic indicator by an outcome: the CDC, 15 states, four cities, and two territories, 4 cities, and 2 territories.
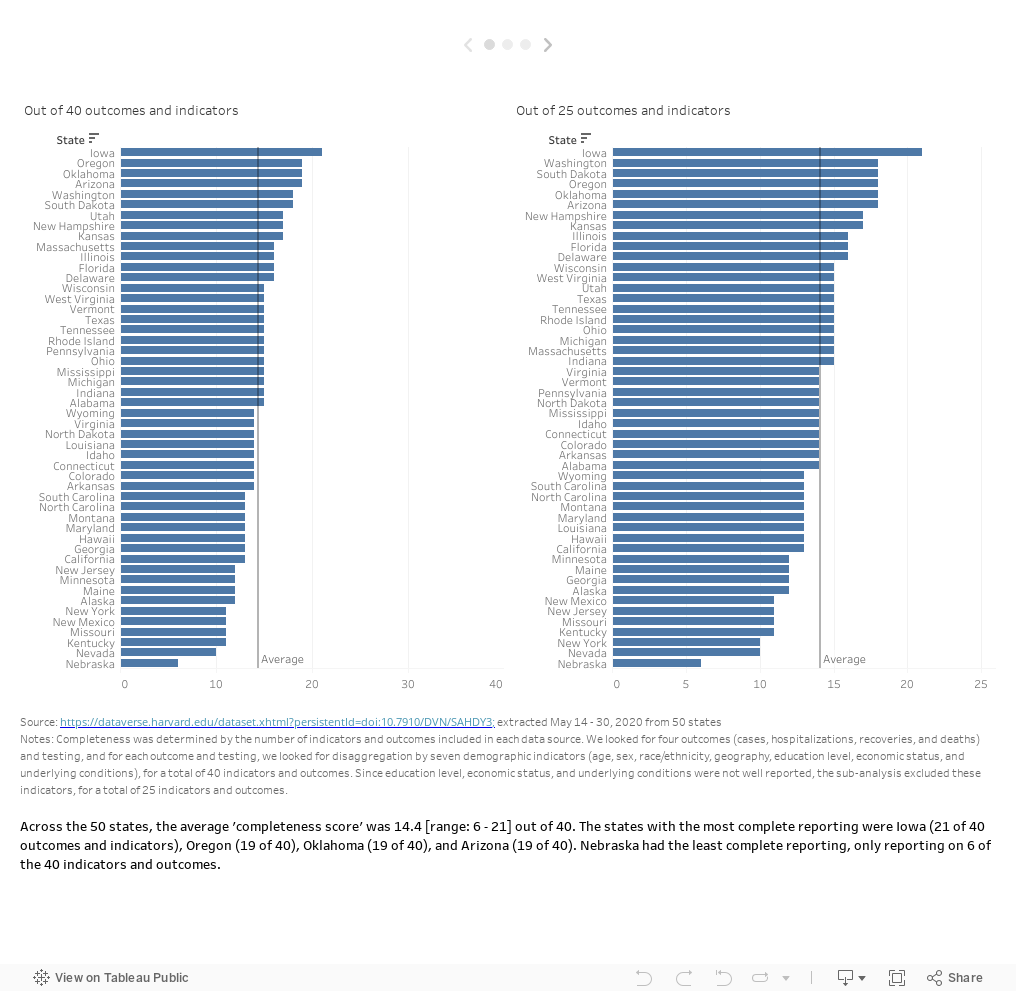
Completeness of COVID-19 data reporting in the U.S.
Only 3 (4%) out of the 70 data sources qualified as having met half of the “completeness score.”
COVID-19 outcomes and testing disaggregated by demographic indicators
Across all sources, only COVID-19 cases and deaths were commonly disaggregated by demographic indicators.
COVID-19 cases: 89% of the 70 sources disaggregated by geography, 83% by age and sex, and 80% by race/ethnicity.
COVID-19 deaths: 77% of the 70 sources disaggregated by geography, 71% by age, 67% by race/ethnicity, and 61% by sex.
Demographic indicators included in intersectional analysis by outcomes
Less than one-third (31.4%) of the 70 data sources examined the intersection of more than one key demographic indicator by an outcome. These include data sources from the CDC, 15 states (30%), four cities, and two territories.

Source - extracted on May 14-30, 2020 from 50 US states, 9 territories, & 10 cities
Note: We examined which sources included intersectional analysis in their reports by looking for disaggregation of outcomes by the intersection of more than one indicator (i.e. cases disaggregated by age, broken down by sex. We recorded which sources included any intersectional analysis for at least one outcome.
18 resources showed intersectional analysis for cases, 13 for deaths, while only 6 for testing, hospitalizations, or recoveries:
Houston is the only source that reported intersectionality information of recoveries
Illinois and West Virginia reported intersectionality for testing
Ohio, Virginia, and Philadelphia reported intersectionality for hospitalizations
Intersectional analysis between age and race/ethnicity was the most commonly examined among the 22 data sources, followed by the intersections between age and sex.
Underlying conditions is only analyzed with other indicators for deaths by three sources (Georgia, Mississippi, and New York) and for cases by one source (Vermont)
Race/ethnicity is the included by most sources in intersectional analysis (30 counts), followed by age (29) and sex (21)
Last update: July 15, 2020.
Recommendations
Reporting and analyses of individual demographic indicators are useful, but they do not paint the full picture of the causes of certain disparities. All demographic indicators are interrelated, and health departments need to strengthen data systems for a more holistic approach to reporting and analyzing data associated with COVID-19 to fully understand the multiple vulnerabilities and begin to address the inequity of COVID-19 infections, hospitalizations, and deaths.
The US remains the epicenter for COVID-19. Having the best data reporting and analysis at the local and national levels can guide containment efforts, build a more targeted response strategy, and foster learnings across cities and states as new hotspots arise. The CDC should work with state and local health departments to coordinate data analyses, translating these data into actionable decisions, and making data available to researchers and the public.
Several states have already formed health equity task forces for COVID-19 with a mandate to investigate how equity data could be collected and reported. This analysis provides a baseline to address the gaps in data collection, reporting and analyses at the national, state and local levels.
Guidelines with standardized definitions of COVID-19 outcomes and testing as well as key demographic indicators should be developed for health officials to ensure consistency in collecting and reporting data and to improve the comparability of COVID-19 data across cities, states, and the nation.
Health departments should disaggregate key demographic indicators by testing and outcomes (cases, hospitalizations, recoveries, and deaths) to understand who within the population get tested, who is at risk of infection and where are they, and what is the disease progression stage for these individuals. This information is vital to deploy rapid contact tracing and isolation strategy to quickly contain the outbreaks. Analyses on the profiles of individuals who get hospitalized and their disease progression can help clinicians to develop targeted treatment strategy for specific population groups.
RATIONALE
As of July 2020, the United States remains as the epicenter for COVID with the highest number of infections and deaths in the world. It is recognized that reporting on COVID-19 data is incomplete and inadequate for robust analyses to guide targeted pandemic response. The current focus on the racial disparities of COVID-19 is only the first step to understanding the disproportionate effects of COVID-19 on different communities in the US. Having more data would allow for a sophisticated and intersectional analysis of COVID-19, moving beyond analysis of any one group or any one demographic factor, but rather taking into account multiple vulnerabilities.
OBJECTIVE
The purpose of our review is to assess how COVID-19 data is reported in the US at the national, state, city, and territory levels, disaggregated by a core set of seven demographic indicators: age, race/ethnicity, sex/gender, education level, economic status, geography, and underlying conditions) on testing, cases, hospitalizations, recoveries, and deaths. We also explore the gaps in data reporting, and how these official data sources examine the intersecting vulnerabilities of COVID-19.
METHOD
We reviewed 70 COVID-19 data sources from the Centers for Disease Control and Prevention (CDC) and health departments across 50 states, nine territories, and ten major cities in the United States between May 14-30, 2020. “Data sources” refer to daily and weekly COVID-19 reports along with COVID-19-specific webpages and dashboards accessed through the health department’s websites from the CDC, 50 states, nine territories, and ten cities. We extracted information on testing and outcomes of COVID-19: cases, hospitalizations, recoveries, and fatalities. These are referred to as outcomes. We examined whether the sources disaggregated these outcomes by seven demographic indicators: age, sex, race/ethnicity, education level, geography, economic status (e.g., income level), and underlying health conditions.
Data completeness is indicated by the incorporation of all outcomes and indicators in data reporting. Overall completeness is determined by the number of indicators and outcomes included in each data source. We looked for testing and four outcomes and for each outcome, looked for disaggregation by seven indicators, for a total of 40 indicators and outcomes. Since education level, economic status, and underlying health conditions were not well-reported, we conducted a sub-analysis which excluded these indicators, resulting in a total of 25 indicators (testing and four outcomes, and for each disaggregated by four indicators – age, race/ethnicity, gender/sex, and geography). We also assessed the whether these data sources conduct intersectional analysis across multiple demographic indicators by the outcomes of interest.
Access full study protocol and database
This project was featured in Think Global Health. Read “One Weak Link and the Whole Thing Falls Apart” from authors Thoai Ngo and Charlotte Brasseux.